Generating an Electrocardiogram
(ECG or EKG)
with an Arduino Mega 2560 Microprocessor,
a Sparkfun Heart Monitor AD8232 Board, and
an Adafruit 3.5" 320 X 480 Color TFT Board
Back Story: You can skip this and jump to Design, Major Components, Construction & Testing, Results, or Next Steps.
A few weeks ago I was talking with my cardiologist about a recent brief tachycardia event that I had had while on a trip to the Maldives. He commented that had I been able to get to a hospital to get an ECG (EKG), from examining the ECG he might have been able to tell a little more about the cause of the event. It had not been convenient for me to get to a hospital at the time so no ECG exists of the event.
A few days later it occurred to me that if I were to build a portable ECG heart monitor, and carry it with me on my travels, I might be able to record any future tachycardia events, and report them back to my cardiologists. I had built a number of microprocessor based projects, including a controller for my BBQ smoker and a custom made robotic toy car. A homemade ECG monitor did not seem out of the realm of possibilities.
After searching the internet I found I could procure an amplifier designed specifically to plug into three ECG leads. The leads attach to those sticky pads that are placed on the chest to get the signal from the heart. The output of the amplifier could be fed into a microprocessor where it would be digitized and prepared for display. I could attach a touch screen to the microprocessor and program buttons on the touchscreen so I could control the functions of the homemade monitor. The microprocessor could be programed to graphically display the ECG on the touch screen, and, it would all be portable.
| 1. An Arduino Mega 2560 microprocessor. It was advised that the Mega would have enough memory to deal with the programming of the touchscreen; the uno may too small. | 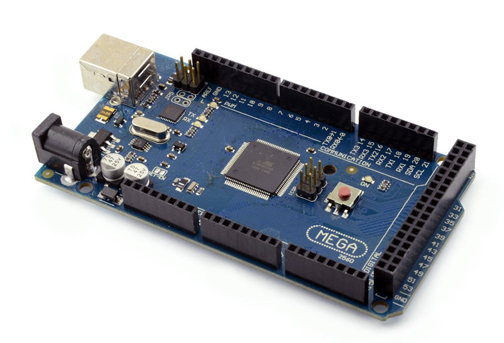 |
| 2. Sparkfun AD8232 Heart Rate Monitor. This is the amplifier with a phone jack for input from the three probes. It actually does not monitor heart rate; it produces an amplified analog output of the electrical activity of the heart. | 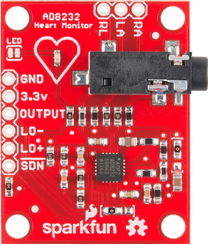 |
| 3. 3M (brand) Red Dot Multi-Purpose Monitoring Electrode; those sticky pads that they paste on your chest and button attach to leads. (You'll need more than a few.) |  |
| 4. Shield-EKG-EMG-Pro Cable for Gel ECG Electrodes; the three leads with phone jack to get the signal to the amplifier. | 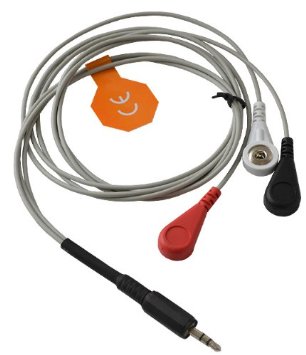 |
| 5. Adafruit 3.5” 320X480 Color TFT Breakout; the touchscreen is 3.5” diagonally across the screen and has 320 X 480 color pixels resolution. | 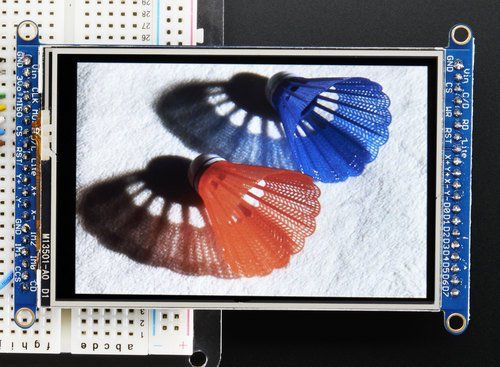 |
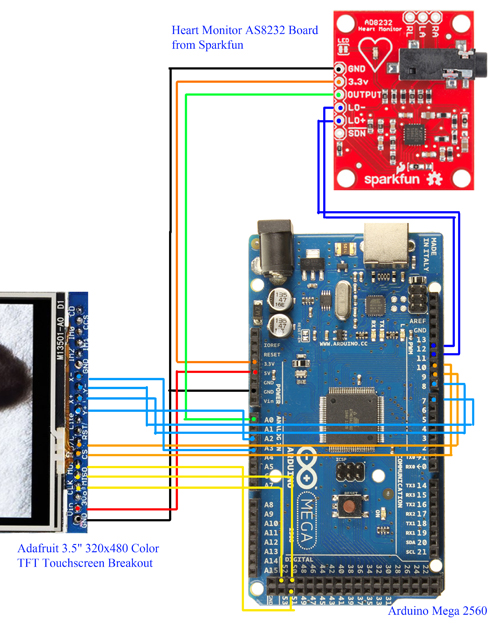
I breadboarded and tested the components in stages, starting with the touchscreen. The touchscreen behaves like two devices, a graphics display screen, and a touch sensitive screen. The two functions operate by separate connections and separate software functions. I downloaded the appropriate software from Adafruit. I wired the touchscreen in the SPI mode suggested by Adafruit; see schematic below..
I tested the graphic and the touch aspect with the software provided by Adafruit.
I needed buttons to help me control the heart monitor. I found that most of the button generating software for the touchscreen were overly complicated, so I wrote my own button software. My buttons are based on a Button class object; I can generate any number of instances of this object, and hence more than one button on the touchscreen.
The Arduino programs I wrote to run the ECG monitor are shown on a separate page. I started with the test software for the touchscreen and the test software for the AD8232, I trimmed what I did not need, combined what remained, added buttons, and added code to have the signal from the AD8232 processed and displayed on the touchscreen.
The finished ECG monitor wiring is shown below.
|
My software has an option for taking continuous readings and displaying them on the touch screen. I added vertical hash marks every second so one could make measurements from the screen to determine the heart rate. I also added a button controlled option for displaying just a single trace. And, I added a button have a test graph displayed, unrelated to the input from the heart monitor amplifier (as a test of the display graphics). In order to test the monitor amplifier one has to plug the leads into the AD8232, attach the leads to the sticky probes, and attach the sticky probes to the chest. If one of the leads is removed the output of the monitor goes “flat line” with little noise.
I attached the probes (sticky pads) as indicated by a Sparkfun figure only to find later that the leads need to be placed in slightly different locations. A more correct location figure is shown at the right. (Figure from: https://lifeinthefastlane.com/ecg-library/basics/lead-positioning/)
|
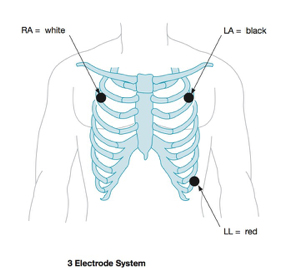 |
When I first ran the device I had quite a bit of noise showing up on the ECG. Some of this was a result of misplaced probes. In moving the probes around on the chest I noticed that the probes are good for about one replacement before the "sticky" fails and one gets a poor connection (resulting in more noise and a weaker signal). I also finally discovered that the probes need to be placed close to what is shown in the figure above. I can feel my ribs and I locate the bottom of my rib cage to put the LL (named Left Leg even though it is not on the leg) probe in place, and count down a bit from my collar bone to place the RA and LA ( named Right Arm and Left Arm) probes.
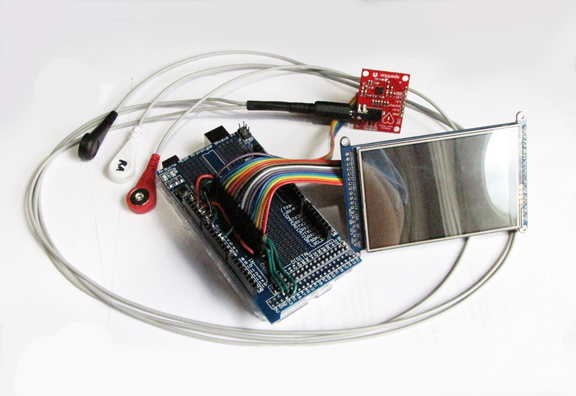
I still had some pickup that appears to be 60 Hz. I suspected some of this was from my rather loose wiring to the breadboard. To clean things up and to make it so I could disengage the wires to use the microprocessor in other applications, I soldered connectors to a protyping board that fits to the Arduino and used ribbon cable to connect the touchscreen heart monitor amplifier to the microprocessor. This reduced the noise a bit. (See figure at the top of the page.)
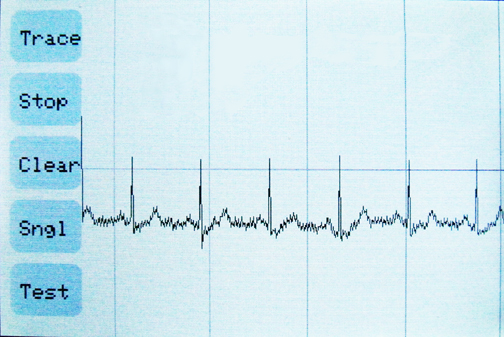
One of my first ECGs is shown at the right. The vertical blue lines are one second markers (generated by my software). One can see that the heart pulses are about 0.8 seconds apart indicating the heart rate at the time was 75 beats per minute. One can also see that there is an irritating level of pickup (those tiny regular spikes the go along with what should be a somewhat smoother trace of my heart's electrical activity.) I'm not sure how to reduce the pickup. The top button, "Trace" starts a continuous trace. "Stop" stops the continuous trace; "Clear" clears the graph. "Sngl" initiates a single trace, that stops automatically after one pass, and "Test" graphs a mathematically generated function to test the graphing functions of the touchscreen independent of the AD8232.
|
 |
Many websites warned that the AD8232 Heart Rate Monitor was not to be used for medical applications, so I’ll follow suite with the same warning (to protect myself legally). It most certainly can not hurt you, and you actually may learn something about your own heart if you use it; so, go ahead and make your own.
Next I would like to get an appointment with my cardiologist (he speaks Chinese) and show him a few of my homemade ECGs. I'm curious as to whether the quality of these ECGs would allow him to tell anything about my heart if it were to exhibit tachycardia again.
If I want to share my ECG with someone (including my cardiologist) I have to photograph the touchscreen, and then send that photograph via email. Unfortunately the photographs of the touchscreen display are not of a high quality. I would like to get a Bluetooth transceiver to attached to the Arduino. With that it could communicated directly with my smart phone, and with an app have my smart phone draw the appropriate ECG graph. I could then capture the smart phone screen and send that via email. Getting a Bluetooth transceiver is not a problem; however I will have to write my own app for my Android smart phone; I’ve discovered that writing apps for Androids is not exactly straight forward, so it may be a few weeks before I get that part of the project completed.
Text and graphs © 2017 by Charles Hartley